My first report to a client, an income & expenses Airbnb report
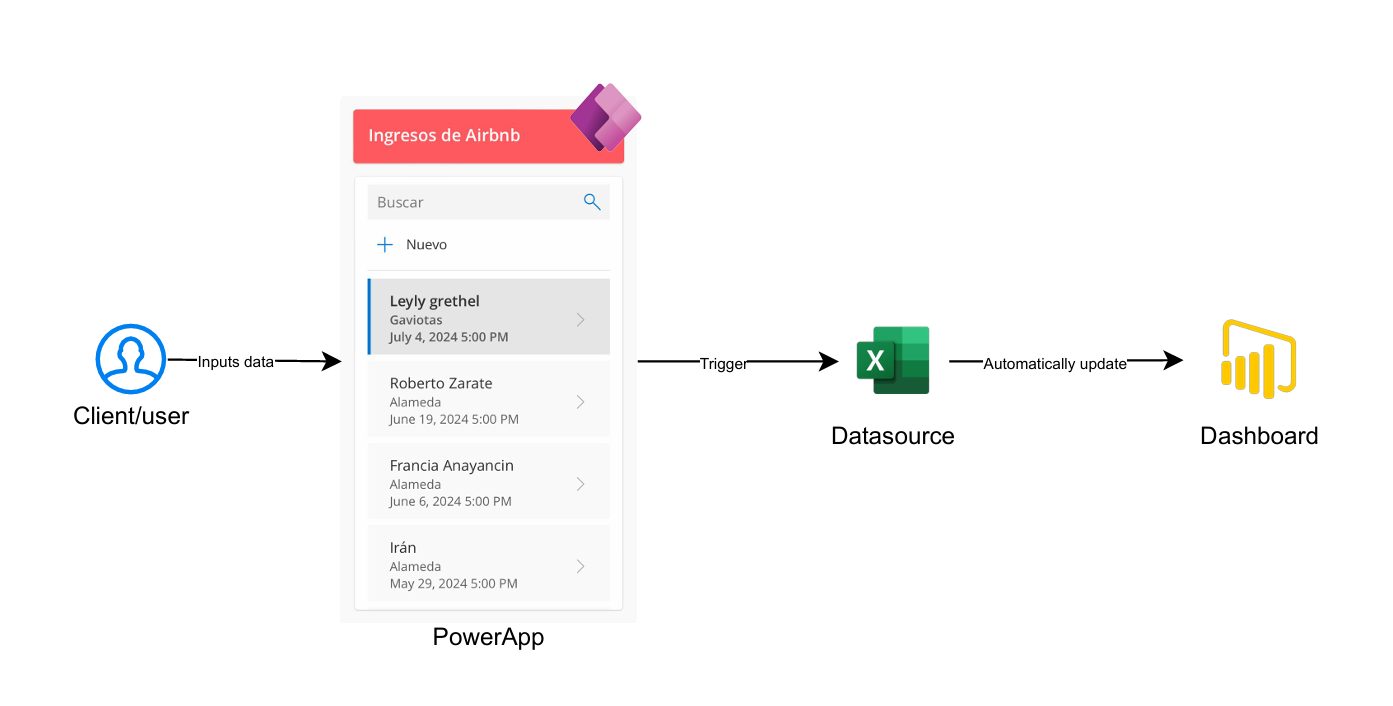
Welcome, here you can explore an interactive report (below) of an Airbnb place. The report was created using the Power Platform and Excel to integrate a comprehensive solution. Power Apps was employed to develop a responsive application (for both mobile and web platforms) for inputting apartment revenues and costs. Once the data was inputted and saved, it automatically triggered a function to update an Excel file with the changes. Subsequently, the results were visualized in a Power BI report. This report includes key performance indicators (KPIs) and a summary of gross incomes and costs. The expense page offers various visualizations categorized by expense type and date, providing detailed insights.
Please, find below the Airbnb report and interact with it. I also included a screenshot of the Mobile version and the dashboard one.
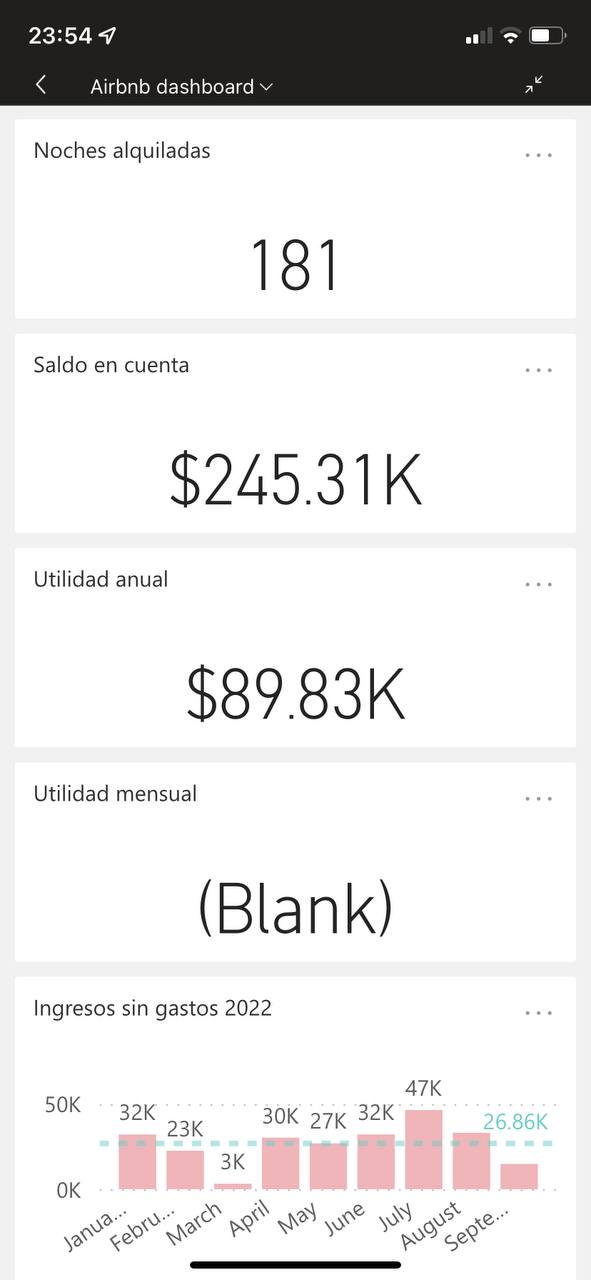
Static mobile user interface
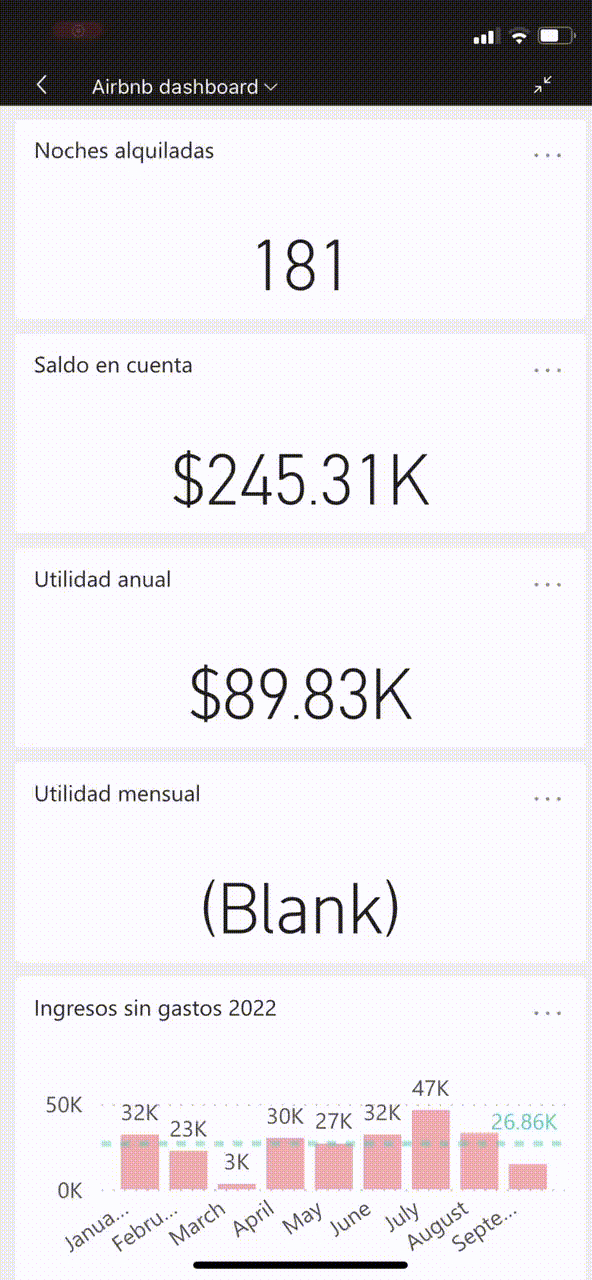
GIF mobile user interface
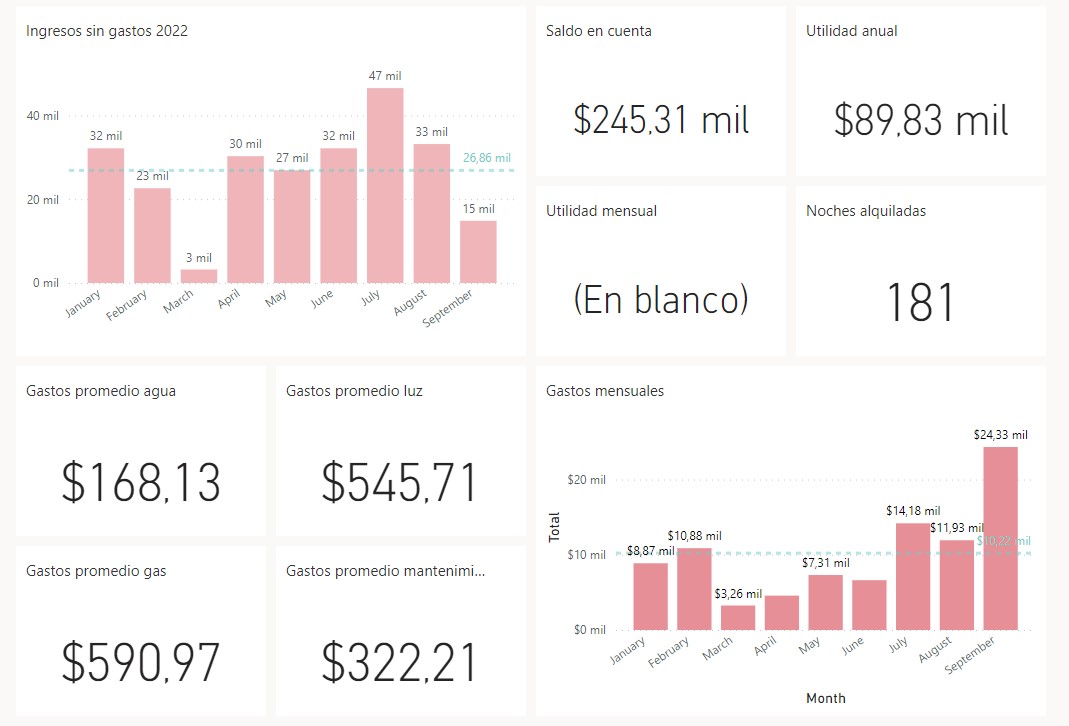
Web version (dashboard)